

Most Canadians carry a retirement number in their head, and it's a big one. A 2026 BMO retirement survey found Canadians estimate they need an average of $1.7 million to retire comfortably, up from about $1.54 million the year before. In British Columbia, the estimate is about $2.2 million.
That's a real read on how retirement feels. But it's a feeling, not a calculation.
The answer gets far more useful when you build it from what retired households actually spend, minus what the Canada Pension Plan (CPP) and Old Age Security (OAS) pay. Here's what that comes to:
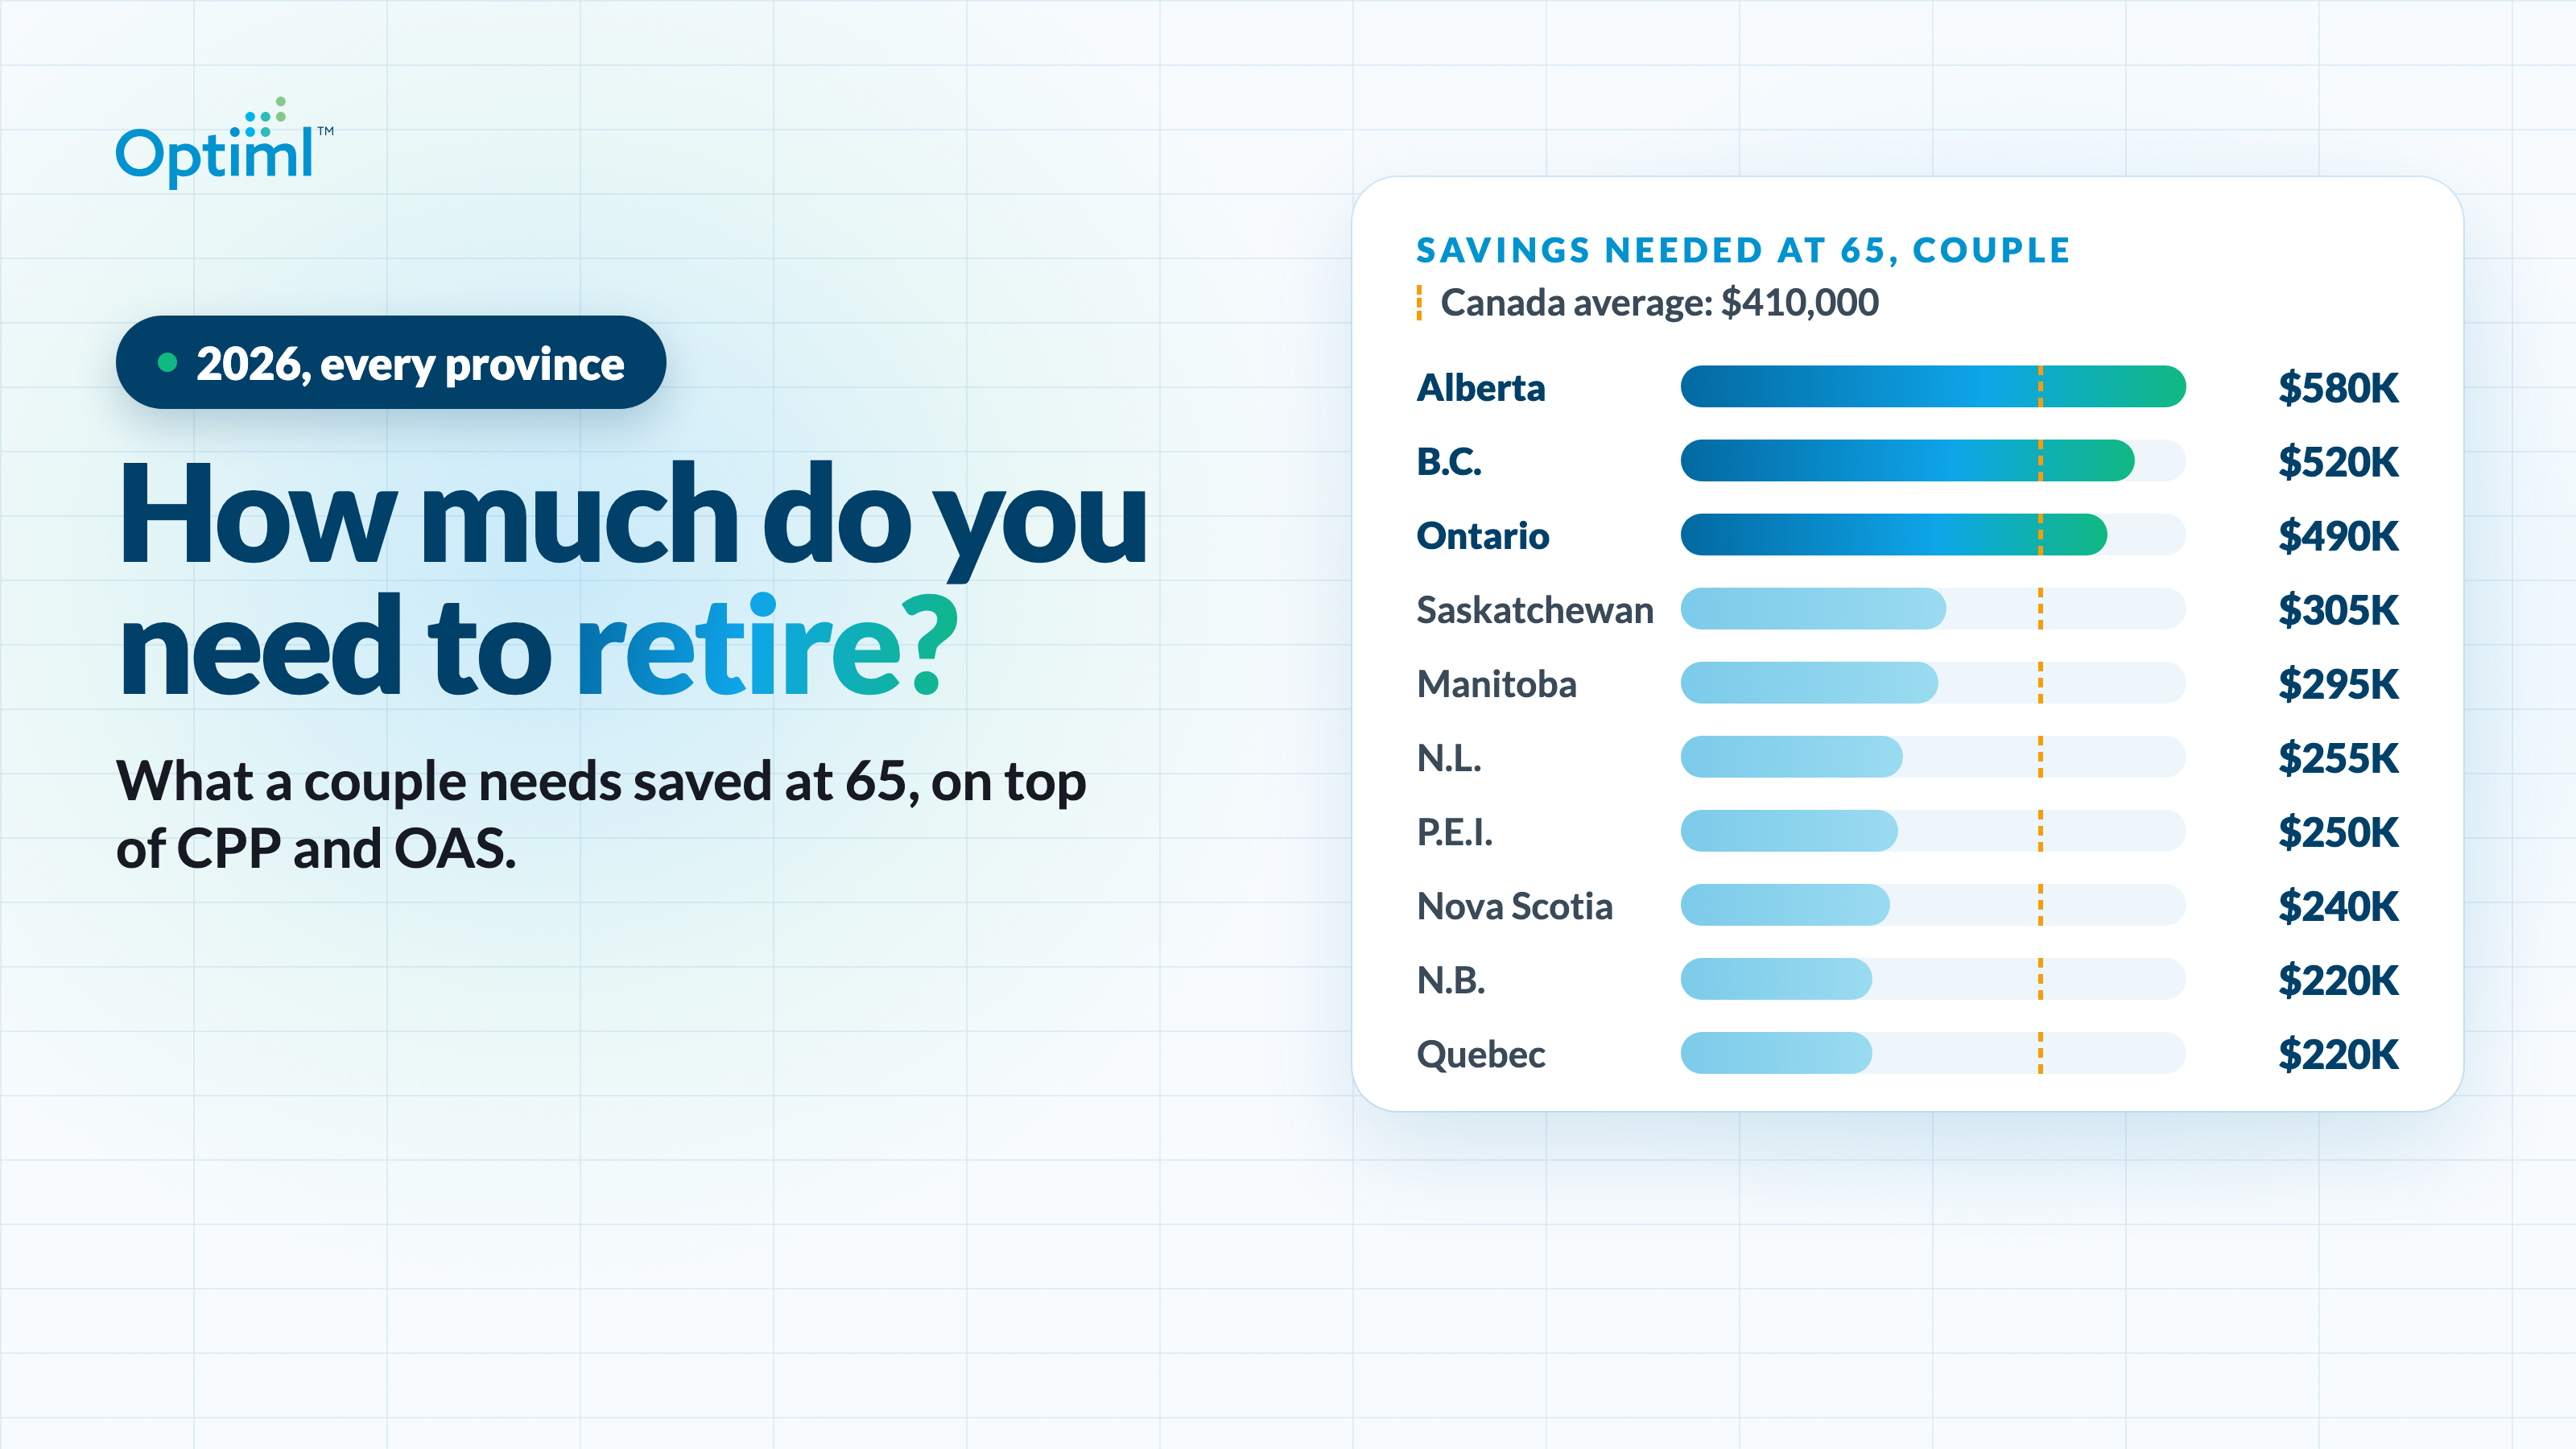
An average Canadian couple retiring at 65 needs about $410,000 in savings, on top of CPP and OAS, ranging from about $220,000 in New Brunswick and Quebec to about $580,000 in Alberta.
So your number isn't a headline figure. It's your gap: what you spend in a year, minus the income you're guaranteed, multiplied by about 23. For an average household, that lands far below $1.7 million.
But averages are only a starting point. Here's the figure for every province, how we built it, and what moves your own number most.
How much a couple needs to retire at 65, by province (2026)
Each row starts with what a retired household spends in a year, based on Statistics Canada's Survey of Household Spending (SHS). It subtracts what CPP and OAS pay a couple who both start at 65, then turns the difference into the savings needed to cover it from 65 to 95.
Spending: Statistics Canada SHS 2023, total current consumption, 65+ ratio applied, in 2026 dollars. Benefits: Canada.ca, 2026. Savings: 4% return, 2% inflation, to age 95, before tax.
Take Ontario. The average retired household there spends about $60,300 a year. CPP and OAS cover $38,900 of that for a couple at 65, which leaves a gap of $21,400. Covering that gap from 65 to 95 takes about $490,000 in savings at 65.
Nationally, the same math gives a $17,900 gap and about $410,000 in savings. The benefits are the same in every row, so what changes from province to province is the spending.
How we built these numbers
Every input comes from a public source. One step is our own estimate. Here's the method.
- Spending. We started with "total current consumption" from the 2023 Survey of Household Spending, the latest edition (it runs every two years). That line covers everything a household buys, and it excludes income taxes, pension contributions and gifts.
- Adjusting for retirement. Statistics Canada doesn't publish spending by age at the provincial level. Nationally, households led by someone 65 or older spent $52,446 in 2023, against $76,146 for all households: about 69%. We applied that ratio to each province's average. That's our estimate, not a published Statistics Canada provincial figure.
- 2026 dollars. We brought each province forward with its own Consumer Price Index (CPI), from the 2023 annual average to September 2026. Prices rose 7.3% in Ontario over that stretch, and 11.0% in Nova Scotia.
- Benefits. A couple, both 65, each receiving the average CPP retirement pension for new beneficiaries at 65 of $858.34 a month (July 2026), plus the full OAS pension for ages 65 to 74 of $762.50 a month (October to December 2026). For two people, that's $38,900 a year. Quebec retirees receive the Quebec Pension Plan (QPP) instead of CPP. The QPP maximum at 65 is the same ,507.65 a month in 2026, and we used the CPP average for Quebec too.
- Savings needed. The yearly gap times about 23. That assumes your savings earn 4% a year after fees, prices and the gap rise 2% a year, and the money lasts 30 years, from 65 to 95. In one line: every $10,000 a year of gap needs about $230,000 at 65.
- Before tax. Every figure is before tax. More on that below.
One caveat matters if you're a couple. Spending is measured per household, but benefits are paid per person, and the 65+ average mixes couples with people living alone. Across all ages, one-person households spent $44,074 in 2023, and couples without children spent $75,976. So a couple's real spending usually runs higher than the average in the table. I'd read the couple figures as a floor for an average-spending couple, not a target.
Why Alberta, B.C. and Ontario need roughly twice as much
Alberta, B.C. and Ontario need roughly twice what Atlantic Canada and Quebec need. The biggest reason is housing.
In the same Statistics Canada data, shelter took 35.7% of household spending in Ontario in 2023, 34.9% in B.C. and 30.6% in Alberta. In Newfoundland and Labrador it was 23.7%, and in New Brunswick 25.4%.
In dollars, the average Ontario household spent $29,136 on shelter that year. The average household in Newfoundland and Labrador spent $15,843.
Shelter is the biggest line in the budget, and retiring on its own doesn't change where you live. Whatever housing costs in your province flows straight into your gap, and every $10,000 of gap needs about $230,000 at 65. Alberta's shelter share sits below Ontario's and B.C.'s, but Alberta households have the highest spending in the table overall, so Alberta lands at the top.
Prices also rose unevenly after 2023: 11.0% in Nova Scotia against 7.3% in Ontario. That's why each province moves forward on its own CPI. Even after the faster climb, Nova Scotia stays among the lowest of the ten.
If you're retiring on your own
The table is built for couples. Retiring on your own uses the same math, with two differences.
First, your guaranteed income is one person's. At the averages, CPP and OAS come to $19,450 a year. Second, there's no partner's income to share the fixed costs. Property tax or rent, insurance, the car: one income carries all of it.
The formula stays the same: your yearly spending, minus $19,450, times about 23.
For example, someone who spends $40,000 a year has a gap of $20,550. That needs about $470,000 at 65, more than the national figure for a couple. It's the clearest case in this post for building the number from your own spending rather than borrowing a household average.
Your CPP moves the number as much as your province does
The table uses the average CPP for a reason. But watch what happens at the top of the scale.
At the CPP maximum of $1,507.65 a month at 65 in 2026, a couple both 65 with full OAS brings in $54,500 a year. That's more than the estimated average retired household spends in seven provinces: every one except Ontario, B.C. and Alberta.
In Ontario, the gap at the maximum drops to $5,800 a year, and the savings needed to about $135,000, against $490,000 at the average.
Few people collect the maximum, which is why the table uses the average. Your CPP depends on how many years you contributed and how much you earned, so your own record can move your number as much as your postal code. For what Canadians actually collect, see our 2026 breakdown of Canadian averages by age.
When you start them matters too
The table assumes both benefits start at 65. Move the start date and your guaranteed income moves with it:
- CPP after 65: 0.7% more for every month you delay, 42% more at 70
- CPP before 65: 0.6% less for every month you take it early, 36% less at 60
- OAS after 65: 0.6% more for every month you delay, 36% more at 70
Full OAS also needs 40 years living in Canada after age 18. Fewer years means a partial pension, and a bigger gap. At 75, full OAS rises to $838.75 a month.
Optiml's CPP/QPP and OAS timing models when to start each one, against everything else in your plan.
What the averages leave out
Tax
Every figure in this post is before tax. That matters, because Registered Retirement Savings Plan (RRSP) and Registered Retirement Income Fund (RRIF) withdrawals are taxable income, and so are CPP and OAS. If most of your savings sit in an RRSP, the before-tax figure understates what you'd need. By how much depends on your province.
Provincial credits vary widely. In 2026, Alberta's basic personal amount is $22,769, and Newfoundland and Labrador's is $11,188. Federally, the age amount of $9,208 helps from 65, but it's reduced as your income rises.
Then there's where each dollar comes from. Couples can split eligible pension income, which lowers the household's tax when one spouse has more income than the other. Here's how pension income splitting works. And Tax-Free Savings Account (TFSA) withdrawals aren't taxed at all. So the order you draw from your RRSP or RRIF, TFSA and non-registered accounts changes the tax bill, and with it, how much you need to have saved.
The house
Shelter is the biggest line in the budget, and whether your mortgage is paid off at 65 changes it. A couple still making mortgage payments at 65 carries a bigger shelter line than one that owns outright, and a bigger gap with it. Selling and renting changes the numbers again. We worked through that decision in keep the house or sell and rent.
Spending over time
Spending usually changes through retirement. The 65+ average spans the early, active years and the quieter ones later on, which suits a 30-year plan. But your own curve won't match it. Here's why retirement spending isn't flat, and how to plan for the shape of yours.
From an average to your own number
An average gives you a ballpark. Your plan gives you your number.
Optiml builds that number from your own inputs: what you actually spend, your actual CPP or QPP and OAS, and the accounts you hold. Then it handles the parts no average can:
- Tax where you live. Federal and provincial tax for all 10 provinces and 3 territories, including Quebec's rules.
- Benefit timing. CPP or QPP start ages (up to 72 for QPP) and OAS start ages, modelled against the rest of your plan.
- Withdrawal order. Which account to draw from, and how much, across your RRSP or RRIF, TFSA and non-registered accounts.
- Income splitting. How a couple shares retirement income to lower the household's tax.
It also answers the two questions behind this whole post. "How much can I spend?" and "When can I retire?" are built-in what-ifs, run on your numbers instead of a provincial average. And if your goal is to spend as much as your plan supports, that's what the Maximize Lifetime Spending strategy is built for.
Every paid plan starts with a 14-day free trial.
The Bottom Line
A $1.7 million headline tells you how retirement feels to Canadians. It can't tell you what you need.
Build the number from what retired households spend and what CPP and OAS pay, and an average couple at 65 needs about $410,000: about $220,000 in New Brunswick and Quebec, about $580,000 in Alberta. From there, your spending, your CPP record, when you start your benefits, your mortgage and your tax picture move it up or down. Every one of those is knowable, and Optiml puts them in one plan.
Retirement isn't about hitting someone else's number. It's about knowing yours.
Frequently asked questions
How much do you need to retire in Canada?
Built from what retired households actually spend minus what CPP and OAS pay, an average Canadian couple retiring at 65 needs about $410,000 in savings on top of those benefits. That covers a $17,900 yearly gap from 65 to 95, before tax. By province, it ranges from about $220,000 in New Brunswick and Quebec to about $580,000 in Alberta.
How much does a couple need to retire in Canada?
At the averages, a couple both 65 receives $38,900 a year from CPP and OAS. The average household led by someone 65 or older spends about $56,800 a year in 2026 dollars, which leaves a $17,900 gap that needs about $410,000 at 65. That average also includes people living alone, so a couple's real spending usually runs higher: treat it as a floor, not a target.
How much do you need to retire in Ontario?
A couple retiring at 65 in Ontario needs about $490,000 in savings on top of CPP and OAS, before tax. The average retired household there spends about $60,300 a year, and CPP and OAS cover $38,900 of it at the averages, leaving a $21,400 gap. If both spouses receive the CPP maximum, the gap drops to $5,800 and the savings needed to about $135,000.
How much do you need to retire in B.C. and Alberta?
About $520,000 in British Columbia and about $580,000 in Alberta for a couple retiring at 65, on top of CPP and OAS. Retired households spend about $61,600 a year in B.C. and $64,200 in Alberta, the two highest figures in our table. Housing is a big part of the reason: shelter took 34.9% of household spending in B.C. in 2023 and 30.6% in Alberta, against 23.7% in Newfoundland and Labrador.
How much do CPP and OAS pay at 65 in 2026?
The average CPP retirement pension for new beneficiaries at 65 is $858.34 a month (July 2026), and the maximum at 65 is $1,507.65. Full OAS for ages 65 to 74 is $762.50 a month from October to December 2026. For a couple both 65, that's $38,900 a year at the average CPP, or $54,500 at the maximum.
Which province needs the least saved for retirement?
New Brunswick and Quebec, at about $220,000 for a couple retiring at 65, on top of CPP and OAS. Retired households in both provinces spend about $48,500 a year in 2026 dollars, which leaves a $9,600 gap. Housing is a big part of the difference: shelter took 25.4% of household spending in New Brunswick in 2023, against 35.7% in Ontario.
Ready to optimize your retirement plan?
Join thousands of Canadians making smarter financial decisions with Optiml.
Start Free Trial